
By now, you probably know that 2023 was the warmest year on record. Climatically speaking, it was also arguably one of the weirdest.
By early summer, it became obvious that something quite unusual was happening. In June, New York and other major cities were smothered by a toxic blanket of smoke from huge Canadian wildfires fanned by warm and dry conditions. When the final global temperature numbers for the month were tallied, it turned out to be the warmest June on record.
As summer unfolded, extreme heat waves proliferated. And deluges and floods devastated areas around the world. One of the most catastrophic occurred in eastern Libya, where many thousands of people of died. While societal factors played a significant role in the devastation, recent research has shown that with climate change, the extreme rainfall was up to 50 times more likely, and up to 50 times more intense.
Month by month, record setting warmth continued from June through the end of the year. And July wound up with the dubious distinction of being the very warmest of any month in records extending back to the 1880s. (In case you are wondering, there have been 2,076 months between 1850 and the end of 2023.)
Unsurprisingly, 2023 didn't simply eke out a win as warmest year — it shattered the previous record, set in 2016. And now that the year just past is in the record books, scientists are grappling with what happened.
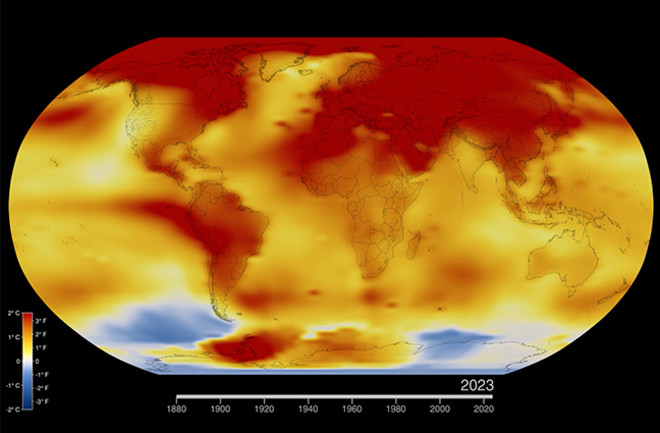
In this column, and in a second part to follow, I'll address that question with the help of a series of visuals. The first one is at the top of this story, a map of the world showing how global temperatures in 2023 varied from the long-term average. The story is told quite vividly by the yellow, orange and red tones covering nearly the entire globe.
But what about causation? To grapple with that question, other visuals will help.
Carbon dioxide, the long-term driver
Visual #2:
Take a close look at the two graphs on the lefthand side of the frame in the visualization above. The top one depicts rising atmospheric concentrations of heat-trapping carbon dioxide.
We humans emitted 40.9 billion tons of CO2 in 2023, mostly by burning fossil fuels, but also through land-use activities like sawing down forests on a huge scale. Although there is a whisper of good news — growth in CO2 emissions has slowed over the past decade — we're still in a heap of trouble.
Carbon dioxide levels reached 424 parts per million last May, "continuing a steady climb further into territory not seen for millions of years," according to a bulletin from NOAA and the Scripps Institution of Oceanography.
The visualization above also documents the impact of the ever-thickening blanket of CO2: Heat accumulating in Earth's climate system has been rising in lockstep. You can see this in the graph at the bottom left of the visual. It runs from the year 2000 through 2023.
James Hansen, former director of NASA's Goddard Institute for Space Studies, has estimated that the energy building up in the atmosphere from our greenhouse gas emissions is equivalent to that from 800,000 Hiroshima atom bombs exploding each and every day.
The intriguing animation on the right side of the visualization shows the atmosphere in three dimensions and highlights the buildup of CO2 during just one calendar year, 2021.
Carbon dioxide is, of course, an invisible gas. But with a model drawing data from satellite observations and ground-based monitoring, NASA has depicted the flow of CO2 through the atmosphere for the year, with the blanket of gas depicted in yellow, orange and red. Both human sources and the biosphere's natural ebb and flow of the gas, primarily from plants in the Northern Hemisphere, are evident in the visualization. (For all the details plus other visualizations, see this page at NASA's Scientific Visualization Studio.)
El Niño Takes Charge
Visual #3:
While greenhouse gases comprise the main long-term driver of global warming, natural variability also played a role in last year's record of misery. And on a seasonal basis, no natural climate phenomenon out-competes the El Niño Southern Oscillation. With ENSO, sea surface temperatures in the central and eastern tropical Pacific Ocean seesaw between cooler La Niña and warmer El Niño episodes, with neutral conditions in between.
As we began 2023, La Niña was in charge, forcing down sea surface temperatures in a broad swath of the Pacific. In turn, that helped tamp down the global average air surface temperature just a bit.
But after dominating the climate system for a year and a half, La Niña petered out, and the tropical Pacific transitioned to neutral in March. Then in May, El Niño took over as climate boss, eventually building into a strong event. The warmer sea surface waters from El Niño spewed heat into the atmosphere, and this helped nudge the global average temperature up.
Josh Willis, a climate scientist at NASA’s Jet Propulsion Laboratory, summed things up this way: "For the most part, it’s us and El Niño. At the end of the day, humans are heating the planet, and El Niño is dancing on our heads."
And the dance ain't over. During the record-setting hot months of June through December, El Niño had not even topped out in strength. That seems to be happening now, which means its peak impact on the global climate is yet to come in 2024. As a result, this year may well beat 2023 as warmest year on record.
Heat from the Deep
Visual #4:
El Niño's heat ultimately comes from the abyss, as can been seen in the animation above showing a gargantuan blob of warm water rising to the surface. This is a normal aspect of the phenomenon, and it accounts for El Niño's characteristic warm sea surface temperatures.
But the animation shows only what was going on along the equator in the tropical Pacific from September through October. One unusual aspect of the current El Niño episode is that it occurred at the same time that extremely abnormal oceanic warmth set in around the world — both at the surface and below.
This takes us back to our role in 2023's extraordinary warmth, and in particular how this has affected all the world's oceans, not just a broad swath in the tropical Pacific. For that, I hope you will read Part 2 of this series.


